
See how people and
assets really move.
Optimize every space.
For hospitals, airports, venues and workplaces - occupancy, dwell, movement and utilization for people and assets alike, on your existing BLE and Wi-Fi. Aggregated, privacy-first, and turned into decisions.

What is people & asset flow analytics?
Flow analytics is the measurement of how people and assets move, gather and dwell within a facility over time. It turns real-time location into occupancy, movement, dwell and utilization metrics, revealing bottlenecks and underused space. Pole Star computes it on your existing BLE and Wi-Fi infrastructure, using aggregated, anonymized data.
It measures occupancy, movement, dwell and utilization for people and assets across your site.
It serves operations, facilities and experience teams in hospitals, transport, venues and workplaces.
Spaces are managed by guesswork, and underused space and bottlenecks cost money every day.
Pole Star turns location into dashboards, heatmaps and trends — aggregated and privacy-first.
Occupancy & utilization
How busy each area is, and how much of your space is actually used through the day.
Movement & flow
The routes people and assets take, shown as flows and heatmaps across the floor.
Dwell & bottlenecks
Where people wait and queues build up, so you can fix the pinch points before they affect operations.
The business challenge: spaces run on guesswork
Most facilities are managed without knowing how they are actually used. Teams decide on layouts, staffing and capacity from intuition and spot checks, not evidence - and the cost of getting it wrong is paid every single day.
The symptoms are everywhere: wings that sit empty while others overflow, queues that form at predictable times, equipment idle in one area and scarce in another. Without continuous data, you can't see the pattern, so you can't fix it.
Real estate and operations are among the largest line items an organization carries. Flow analytics turns movement into evidence, so space, staffing and flow decisions are based on how the building really behaves.

The cost of not measuring - workplace, the most-documented case
What changes when movement becomes measurable
Concrete outcomes operations, facilities and experience teams see with flow analytics.
Right-sized space
See what's really used and reduce wasted floor area without hurting experience.
Shorter queues & waits
Spot bottlenecks and act on them before they turn into complaints.
Smarter staffing
Align people to when and where demand actually peaks.
Better asset utilization
Understand how equipment moves and is used to buy and place it wisely.
Improved experience
Smoother journeys for patients, passengers and visitors alike.
Evidence-based decisions
Replace guesswork with data when you plan layouts, capacity and investment.
Sound familiar?
What teams say before they can see how their spaces are really used.
We're planning a costly expansion, but we don't know if we're really full.
Capital decisions get made on assumptions instead of evidence.
Queues build up at the same spots every day and we just live with it.
Recurring bottlenecks quietly erode experience and throughput.
Half our rooms feel empty while people fight for the others.
Space is misallocated because usage is invisible.
We buy more equipment because we can't tell how the current fleet is used.
Poor visibility drives over-purchasing and waste.
We want flow data, but we can't put cameras on people.
Privacy concerns block traditional people-counting approaches.
Manual counts give us a snapshot, not the real pattern.
One-off surveys miss how usage changes by hour, day and season.
From movement to measurable insight
Wireless infrastructure
BLE / Wi-FiYour existing network and BLE tags sense presence and movement - no cameras, no parallel system.
Positioning engine
Real-timePole Star computes where people and assets are across every zone and floor.
Aggregated flow data
AnonymizedIndividual positions become aggregate counts and patterns - flow analytics without identifying anyone.
Analytics & dashboards
HeatmapsOccupancy, dwell, movement and utilization are turned into live dashboards, heatmaps and trends.
Insights
PatternsBottlenecks, peak times and underused areas surface clearly from historical and live data.
Action
OutcomeRight-size space, rebalance staffing and smooth flow, then measure the result.
An emergency department sees on the heatmap that patients pile up in one waiting zone every weekday afternoon while another sits empty. They shift triage and signage, and the next week's data shows the queue has flattened - a decision made on evidence, not a hunch.
Heatmaps, flows and the metrics that matter
The platform turns aggregated location into a clear picture of how your building behaves - from a single zone to your whole estate.
Footfall & counts
How many people pass through each zone, by hour, day and season.
Occupancy & utilization
How full each area is and how much of your space is genuinely used.
Dwell time
How long people and assets stay in a zone - the signal for queues and bottlenecks.
Movement & routes
The paths people and assets take, and where flows converge or stall.
Asset utilization
How often equipment is in use, idle or clustered in the wrong place.
Trends over time
Historical patterns to compare periods and measure the impact of changes.
Everything you need to turn flow into decisions
Built around the questions operations and facilities teams actually ask.
Live heatmaps
See busy and quiet zones at a glance, in real time and over any period.
Spot hotspots instantly.
Occupancy dashboards
Track how full each area is against capacity, by hour and day.
Right-size with confidence.
Dwell & queue analysis
Measure how long people wait and where queues build up.
Fix bottlenecks before they bite.
Historical trends
Compare periods and see how usage shifts over time.
Measure the impact of changes.
Privacy by design
Flow is computed from aggregated, anonymized data - no cameras, no individual tracking.
Insight without surveillance.
Export & API
Pull flow data into your BI tools and systems through open interfaces.
Fits your existing reporting.
What teams solve with flow analytics
Cut emergency-department waits
Patients pile up in waiting areas at peak times.
Dwell and occupancy data pinpoint the bottleneck.
Triage and flow are adjusted, waits fall.
Ease airport queues
Passenger queues form at security and check-in.
Flow data shows where and when congestion builds.
Staff and lanes are rebalanced to demand.
Right-size the workplace
A costly office expansion is on the table.
Occupancy data reveals true utilization.
Space is right-sized, cost avoided.
Understand retail footfall
A venue wants to know how visitors move.
Heatmaps show routes, hotspots and dead zones.
Layout and placement are optimized.
Optimize an equipment fleet
A hospital keeps buying more equipment.
Asset utilization data shows what's really used.
Fleet is sized and placed on evidence.
Plan for events & peaks
A site must handle predictable surges.
Historical trends model peak behaviour.
Resourcing is planned ahead of the peak.
Where flow analytics delivers most
The environments where understanding movement changes operations.
Healthcare
Understand patient journeys, cut waiting times and right-size clinical space and equipment fleets.
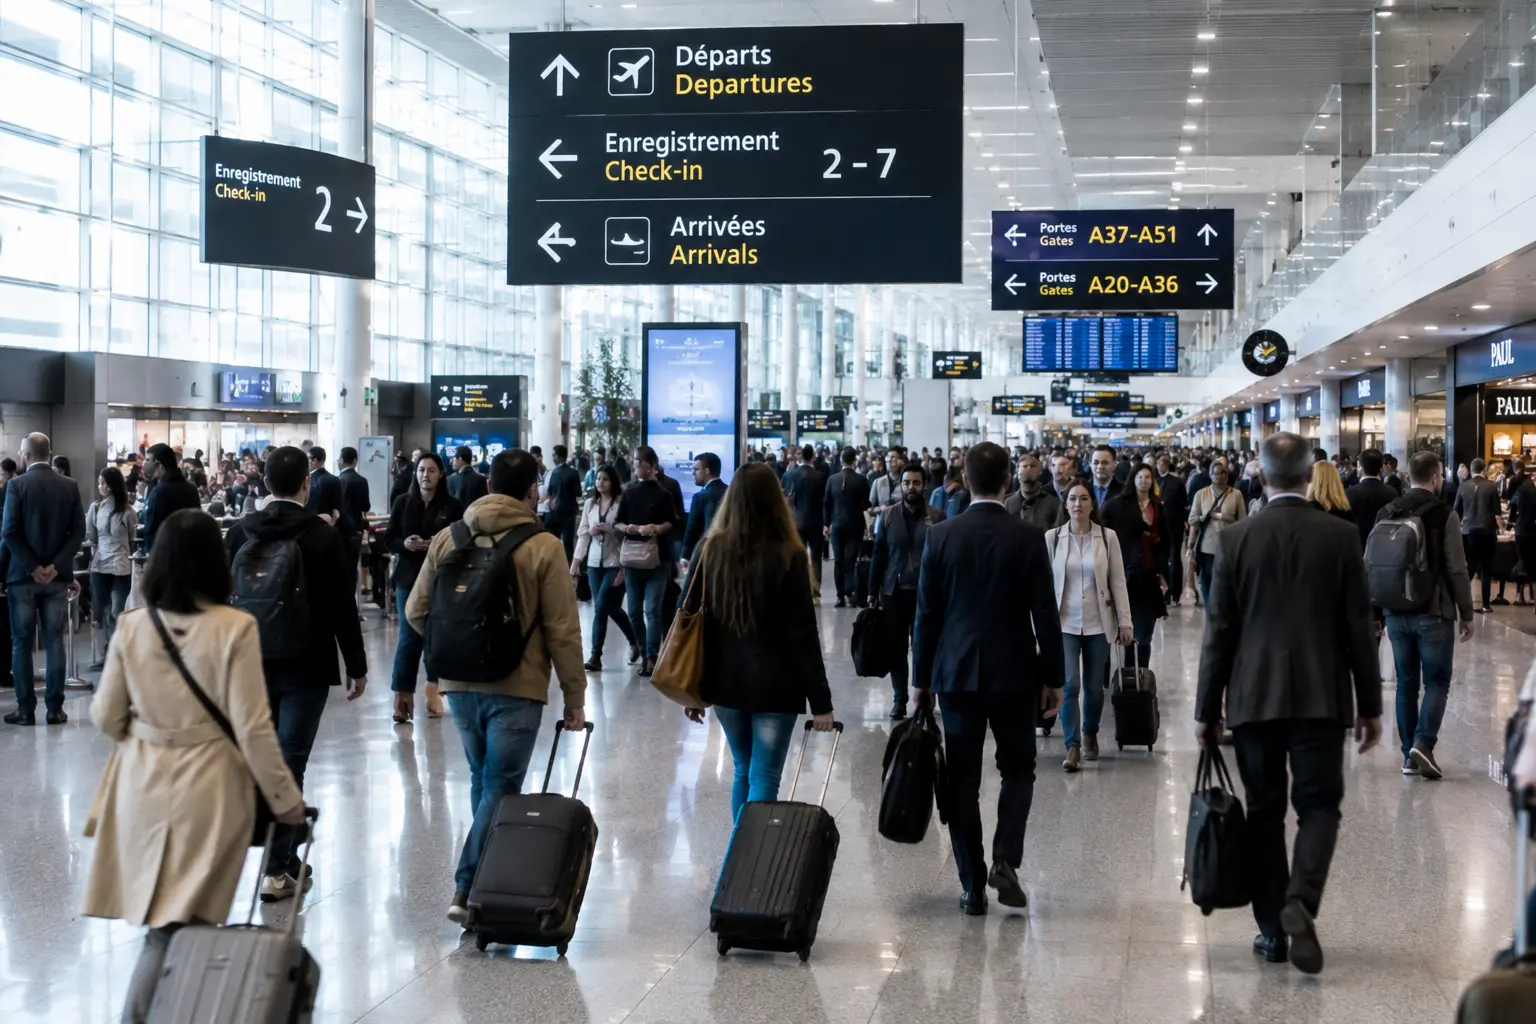
Airports & transport
Measure passenger flow and dwell to ease queues, balance staffing and improve the journey.

Venues & retail
See how visitors move to optimize layout, placement and crowd management.
Flow analytics in demanding, high-traffic sites

Healthcare
Understand how patients and mobile equipment move through a busy emergency department.
Flow analytics on existing infrastructure, with NAO Track, NAO Viewer and NAO Flow.
- Movement of 100+ mobile assets analyzed across the department
- Flow and dwell visible on one live map, aggregated
- Evidence to improve equipment placement and patient flow
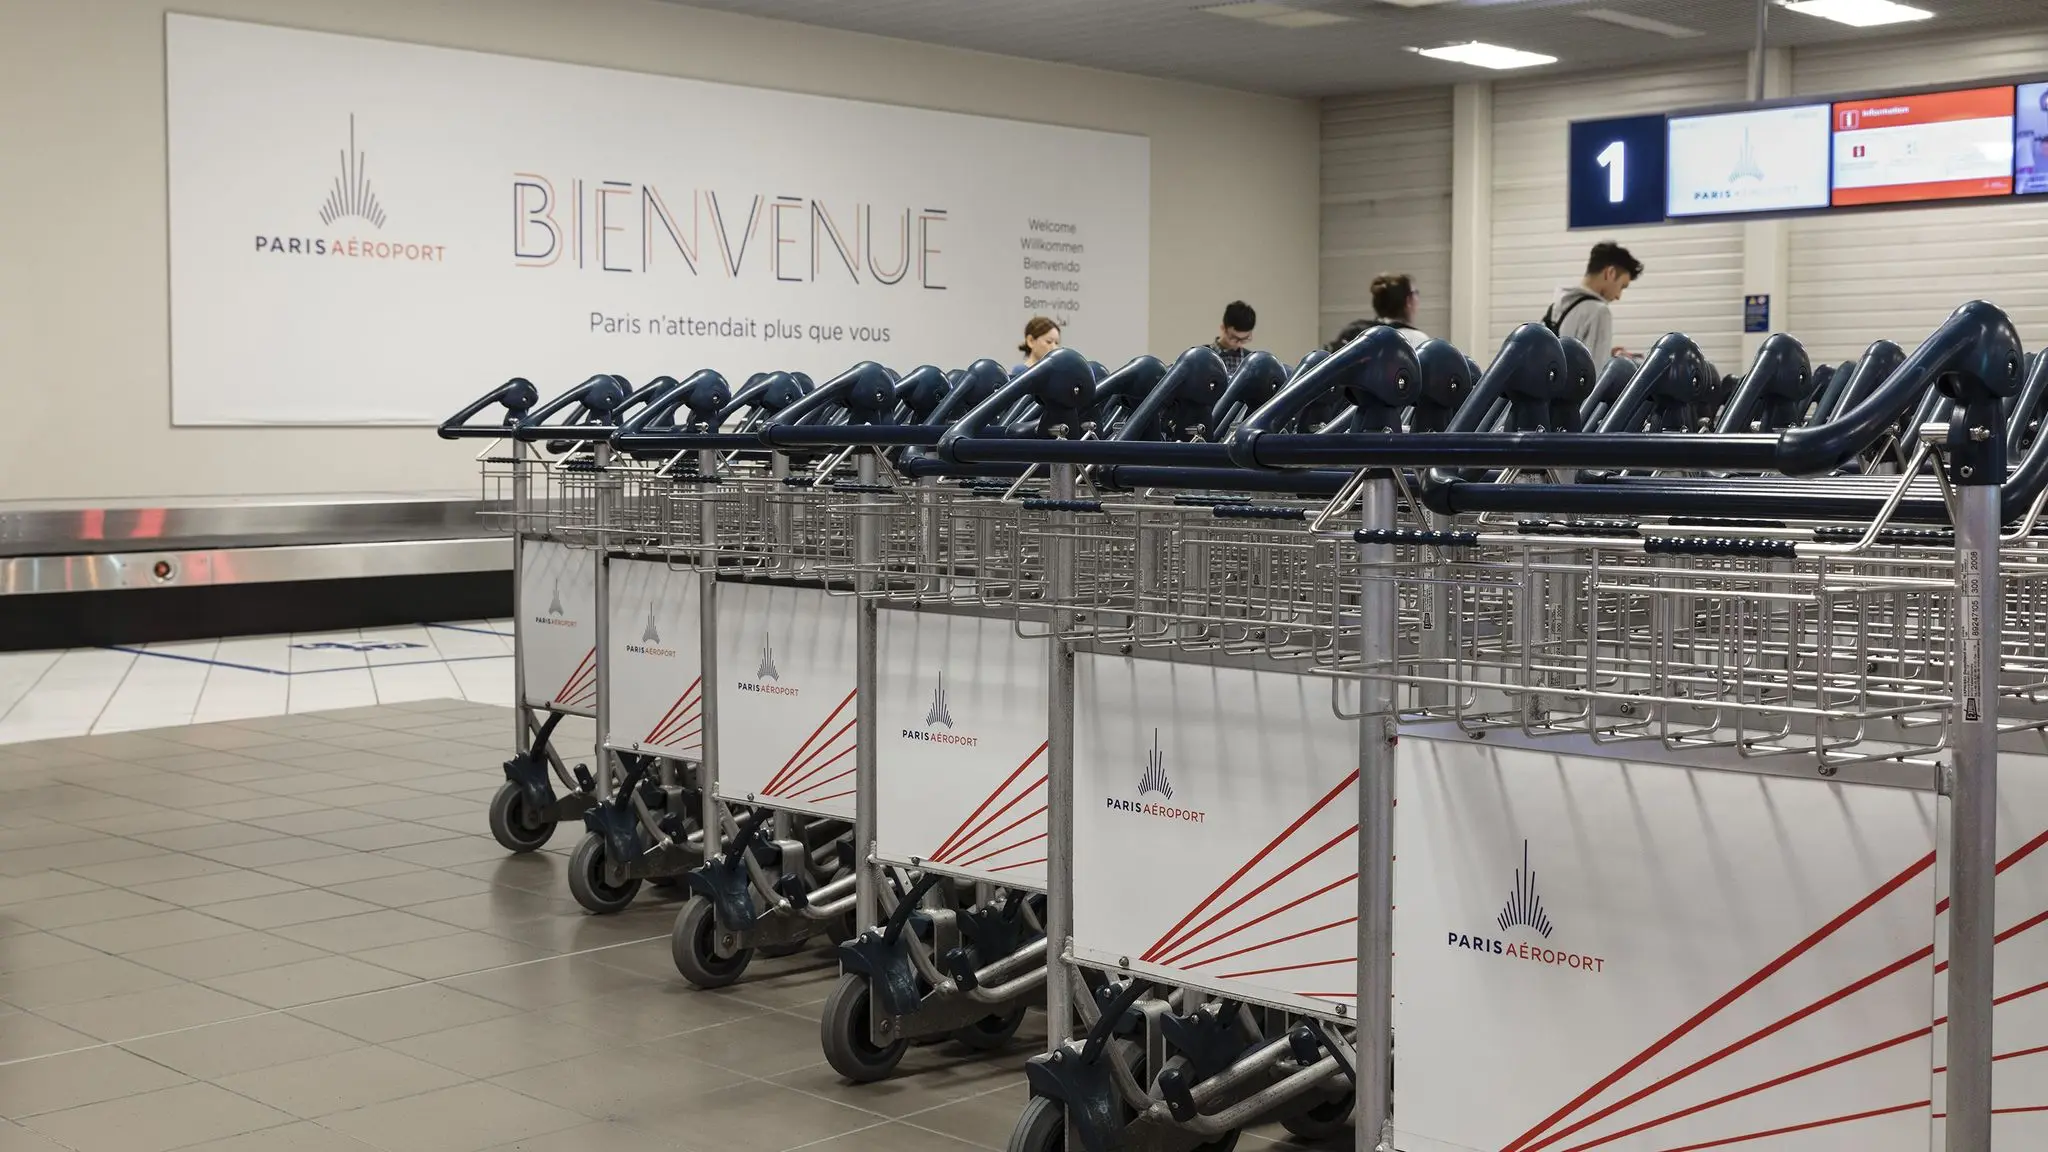
Airports
Understand how thousands of baggage carts move and cluster across terminals.
Flow analytics on existing Cisco access points, with NAO Track, NAO Viewer and Cisco Spaces.
- Movement of 6,000-10,000 carts analyzed across the airport
- Zone counting and flow on 2,000+ BLE-enabled access points
- Evidence to rebalance carts and reduce shortages at peak
Pole Star vs manual counts vs camera analytics
Whole-site, continuous data
Every zone measured all the time, not sampled - so the pattern is real, not a snapshot.
Privacy-first by design
Flow comes from aggregated, anonymized location - no cameras and no individual tracking.
People and assets together
The same platform analyzes visitor flow and equipment movement on one deployment.
Flow analytics, answered
What is people and asset flow analytics?
It is the measurement of how people and assets move, gather and dwell in a facility over time. Pole Star turns aggregated location into occupancy, movement, dwell and utilization metrics, shown as dashboards, heatmaps and trends.
How does it measure flow without cameras?
It uses BLE and Wi-Fi to sense presence and movement, then aggregates that into counts and patterns. There are no cameras and no images - only anonymized flow data.
What can it measure?
Footfall and counts, occupancy and utilization, dwell time, movement and routes, asset utilization, and trends over time - for both people and assets.
Does it work in real time and historically?
Yes. You get live dashboards for what's happening now and historical data to compare periods and measure the impact of changes.
How accurate is the flow data?
Location is computed to zone and room level, on the order of 1-5 meters with BLE. For flow analytics, zone-level accuracy is more than enough to reveal patterns and bottlenecks.
Can it analyze assets as well as people?
Yes. The same platform measures how equipment moves and is used, so you can optimize fleets alongside people flow.
Does it run on our existing network?
Yes. Flow analytics runs on existing BLE-enabled Wi-Fi and Cisco Spaces, as well as HPE Aruba - no cameras and no dedicated parallel network.
Do people need to carry anything?
For aggregate people flow, no personal device or tag is required. For asset flow, assets carry BLE tags. The approach is tailored to what you want to measure.
How long does it take to deploy?
Because it reuses existing infrastructure, deployment is efficient and typically measured in weeks per site, depending on size and layout.
Can we export the data to our BI tools?
Yes. Open APIs and export let you pull flow data into your own dashboards and business-intelligence tools.
Does it scale across sites?
Yes. Flow analytics scales from one building to an estate, keeping consistent metrics and dashboards across locations.
What is the ROI of flow analytics?
Returns come from right-sizing space, reducing queues, aligning staffing to demand and optimizing asset fleets. Because real estate and staffing are major costs, better decisions here pay back quickly.
Can it reduce real-estate costs?
Yes. By showing true utilization, it helps right-size space - research shows right-sizing on real usage data can cut workplace costs substantially.
Can it help reduce queues and waits?
Yes. Dwell and occupancy data pinpoint where and when bottlenecks form, so you can act on them and measure the improvement.
Can we reuse the same system for other use cases?
Yes. The same platform powers asset tracking, worker safety and navigation, so flow analytics shares one deployment.
Who benefits most from flow analytics?
Hospitals, airports, stations, venues, retail and workplaces - anywhere movement and space utilization drive cost and experience.
Does it track individuals?
No. People flow is computed from aggregated, anonymized data. The goal is understanding patterns, not identifying or following individuals.
Is it privacy compliant?
Flow analytics is designed with privacy in mind, using aggregation and anonymization, and is configured to each organization's data-protection policy.
Are any images or video captured?
No. Unlike camera-based analytics, Pole Star uses BLE and Wi-Fi signals only - there are no images or video involved.
Can data stay on-premise?
Yes. On-premise deployment keeps the engine and data inside your own infrastructure, which suits sites with strict data requirements.
Who can access the analytics?
Access is role-based, so administrators control which teams can view dashboards and data, matching each role's responsibilities.
See how your spaces really flow
Book a demo and we'll show heatmaps, occupancy and flow analytics live on your own floor plans.
- Runs on your existing Cisco / Aruba infrastructure
- People and assets, aggregated and privacy-first
- Real-time and historical, no cameras